This November 4th, there are lots of things on the Somerville ballot, including 3 ballot questions. You can see sample ballots here for each ward in the city. Plenty of ink has been spilled on Question 3 (including my own ink in this thread on Mastodon). Question 1 is (imo) simple because either we update the charter this year or we keep the version that was mostly written in 1899. I think we should update to this version and see how that goes for a while. (While it’s not exactly easy to amend the city’s charter, this one would be more easily amended in the future if we manage to do additional things I want like voting rights in municipal elections for non-citizen residents and 16-17 year olds.) If you want to dig in more on this question, the charter proposal, charter committee minutes, and the old charter language can all be found in this public google drive folder (and most of that is also on the city’s website, as well, but I bookmarked both).
Question 2 is, separately from Question 1, whether or not to have a 4 year mayoral term. (The proposed charter in Question 1 continues the current policy of 2 years for mayor as well as 2 years for city councilors.) This question is on our ballot because two years of arguments between Mayor Ballantyne and City Council over the length of term for mayors and city councilors didn’t result in them coming together on a decision. They finally (after some bitter fighting, tbh) agreed to put it on the ballot separately from the rest of the charter. If Question 1 has more than 50% yes votes, the new charter is enacted. If Question 2 has more than 50% yes votes, the mayor (in future election cycles; not the current one) would have a 4 year term, whether or not we adopt the proposed charter in Question 1.
HERE’S MY TAKE: I am voting against Question 2 at this time. I think the city council and mayor should both have 4 year terms, to be honest, but I am against changing one without changing the other. The Somerville mayor already has a lot of power in the city. Somerville currently votes every 2 years on both city council and mayor. The ballot proposal before us would make the mayoral term 4 years, but wouldn’t change the city council term.
Want to hear more? I’ve got some historical voter turnout, some bananas pieces of history, and a regression equation or two!
What Can Our History Tell Us?
I’ve been looking at the Somerville elections archive a lot lately for a school project, and doing lots of statistical analysis of the past ~30 elections. (I wanted a statistically representative sample. I originally intended to go further back until I realized how much work this data is, to get it into a proper configuration that can be analyzed in Stata!) There are two election years that are (in my opinion) worth looking at when trying to answer the question, “What kind of turnout might we expect if the ballot doesn’t have the mayor on it?” I think this is an important question to examine when we consider changing the term length for one without the other, because I think fewer voters participating makes a less representative democracy as a whole.
In 2007, we had a really weird electoral year that might be useful in this convo. There was a special prelim (in April) and special general election (in May) for an at-large city council seat, with no mayoral race on the ballot. That was followed by a normal-cadence prelim (in Sept) and normal-cadence general election (in Nov), with both city council and mayoral positions contested on the ballot.
In 1978 and 1979, we also had a weird electoral “year” — the end of Nov 1978 was a special prelim election for an at-large city council spot, Jan 1979 was the special general election for that seat, then in Oct 1979 was a normal-cadence prelim for mayor (not enough competition for prelim on the at-large seats), and finally a normal-cadence general election in Nov 1979 for both mayoral and at-large seats (with 8 candidates running).
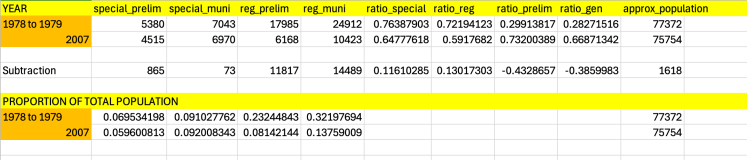
In the above spreadsheet, “ratio_special” is the number you get when dividing the prelim special race voter turnout by the municipal (aka “general election”) special race voter turnout. The “ratio_reg” is the regular prelim divided by the regular municipal (aka “general election”) turnout. The “ratio_prelim” is the special prelim divided by the normal prelim, and the “ratio_gen” is the special municipal divided by the regular municipal.
So, looking at that table above, you might notice that the 5380 voters from the special prelim election at the end of 1979 were 76.38% of the total voter turnout of the special municipal election in January 1979. The 1979 voter turnout for the special municipal election (not the primary, the general election for an at-large city councilor without a mayor on the ballot) was a shocking 28% of the turnout in the usual general election (when there was a mayor on the ballot).
In 2007, the special election general turnout was 6970 voters (when at-large councilor was on the ballot but not mayor), which equaled 67% of the number of voters who turned out in the non-special election (when there was a contested mayoral race as well as city council races). So having the mayor on the ballot drives higher voter turnout, in general.
I then tried to figure out what percent of the total population we were talking about in these races, to see if I was comparing apples to apples. Census data is (ugh, probably Trump’s fault) not super accessible right now, but this website has some numbers I used for approximation of population — 1980 population to represent 1978/1979 and 2010 population to rep 2007. The population of Somerville hit a high of 103,908 people in 1930, but 1980 to present has only fluctuated between a low of ~75k (2010-2012) and a high of ~81k (2020). Thus, despite not having precision, I feel like those are reasonable numbers to use, here.
If these are patterns that hold, Somerville turns out MUCH more for elections when the mayor is on the ballot. The special election in 1978/1979 (for at-large, no mayor) turned out 7% to 9% of the approximate population of the city. The normal prelim (for mayor, no at-large) that year turned out 23% of the approximate population, and the normal municipal race (with both mayor and at-large city councilors on the ballot) turned out 32% of the approximate population.
That makes the 2007 race feel kinda dire, to me. The special prelim and special general election turned out 6% and 9% of the total population with only at-large city councilors on the ballot, but the regular prelim (both city council and mayor on the ballot) still only turned out 8% of the total population, and the regular general election (both city council and mayor on the ballot) only turned out 14% of the total population. That 14% turnout used to be 32% turnout for a similar kind of race!
Somerville Voter Turnout — How Low?
I spent the past ~week going through the city’s detailed data on mayoral elections and voting and primaries and ballot questions. Here are the variables I explored:
- year (1963 to present, because creating and data cleaning spreadsheets from even further back than that was super overwhelming)
- number of mayoral candidates in the primary & general
- number of women who were candidates in the primary & general
- number of POC who were candidates in the primary & general
- number of at-large candidates in the primary & general
- ward voting patterns (that also got super overwhelming very quickly)
- percent of total vote that each ward represented in each race
- whether there was a ballot question in the general election (and if so, how many)
- whether there was an incumbent in the primary & general (aka, whether the incumbent survived the primary, which didn’t happen in 10% of those elections!)
- how many prior terms the incumbent had, if running
- the approximate population of Somerville
- the percentage of the total population that turned out to vote in the primary & general
- whether it was a special election or the normal (Sept/Oct primary, Nov general) cadence
Some Fun Things I Discovered
There were SEVENTEEN at-large candidates in the October 1985 preliminary race as well as in the 1975 preliminary race, but that is NOTHING to the TWENTY-NINE AT-LARGE CANDIDATES OF THE PRELIMINARY IN 1971. There were a total of 308 at-large candidates during the 31 preliminary races I looked at between 1963 and today. BANANAS.
The vast majority of ballot questions have been put to the voters on even-numbered years, when there are presidential elections or at least state-level elections. There were only 10 ballot questions in the 31 (odd-year) races I looked at, and 9/10ths of them were in the period between 1971 and 1983. Two of them were literally ballot questions about licensing Beano as a game in Somerville, ISYN. Somerville in 1971 was apparently a wild time!
Of the 107 candidates for mayor in the primary races I looked at, a woman was a candidate 22 of those times, and only 9 times did a woman advance to the general election. Somerville elected Dorothy Kelly Gay twice, as you might know, and Katjana Ballantyne twice, as folks are definitely are aware. Only once prior to this year was there a Black person as a mayoral candidate (Will Mbah), so far as I am aware. We have never (so far) elected a person of color to mayor, so far as I have been able to discern.
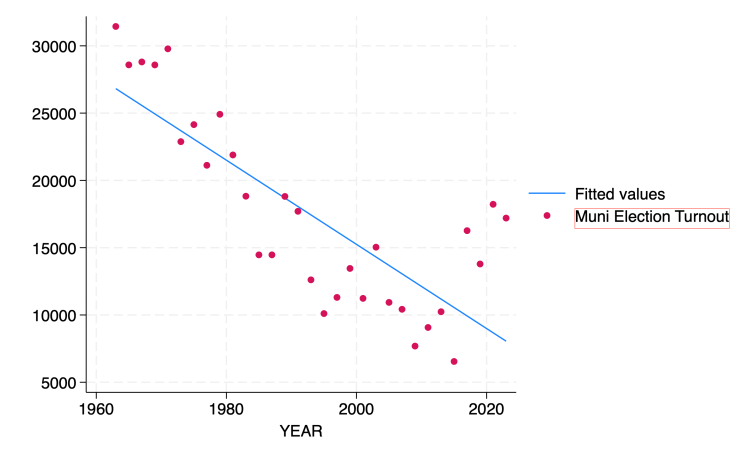
There is a statistically significant and moderate negative correlation between year and voter turnout. That is to say, as the years go on, voter turnout has generally gone down. Correlation between year and prelim voter turnout is -0.7255 and correlation between year and general election turnout is -0.7968. If the correlation had gone as far as -0.8, that would be considered a strong negative correlation, statistically speaking. Again, the blue line in the above scatterplot demonstrates this.
What Patterns Can We Find?
So, how can we understand the pattern of Somerville voters during this time? I did a shit-tonne of regression equations (which means I have to use Adjusted R-squared, for those of you who have taken statistics). After all those variables and lots and lots of permutations of equations … here’s what I’ve got.
Stata code: regress muni_voted incumb_running approx_pop year ballot_q
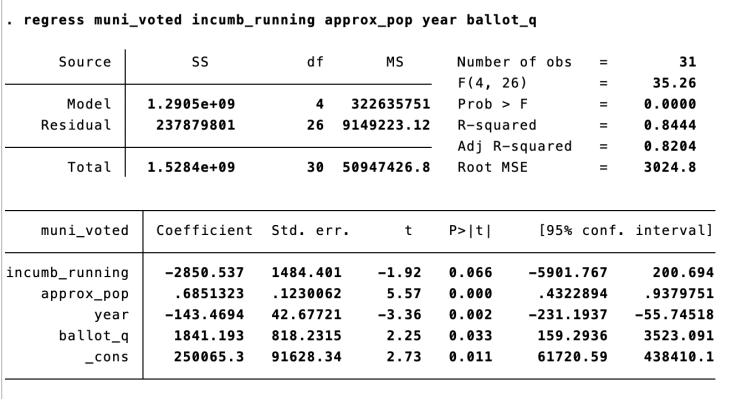
Linear Regression:
Predicted Municipal Voter Turnout = 250065.3 – (Incumbent Running x 2850.537) + (Approx Somerville Population x 0.6851323) – (Year x 143.4694) + (Number of Ballot Questions x 1841.193)
This calculation says that Somerville’s turnout in the general election is approximately 250,065 minus 2850 if there’s an incumbent in the race, plus the approximate city population (multiplied by 0.69) minus the year (multiplied by 143.4694) plus the number of ballot questions in the general election (multiplied by 1841.193).
Things to pay attention to in this are (imo) as follows:
- When the year goes up, the turnout goes down by a factor.
- When there’s an incumbent in the primary, turnout goes down by a factor.
- The multiplier of the population of the city is less than one.
All of those make sense to me – there used to be more voter engagement in the past than there is now, there’s more voter engagement when the incumbent isn’t running, and we don’t multiply the total population by a factor greater than one. (This is not to say I think it’s a good thing that voter turnout has gone down over time, to be clear! Just that I can wrap my head around this.)
This Regression’s Prediction for 2025
Predicted Municipal Voter Turnout = 250065.3 – (2850.537) + (82,000 x 0.6851323) – (2025 x 143.4694) + (3 x 1841.193)
Predicted Municipal Voter Turnout = 250,065.3 – (2,850.537) + (56,180.8486) – (290,525.535) + (5,523.579)
Predicted Municipal Voter Turnout = 18,394
This regression equation accounts for 82% of the variation in the data (the Adjusted R-squared), and all but one of the p-values for each coefficient are better than 0.05, so they’re pretty darn statistically viable other than the factor for whether there’s an incumbent running, which is still really close to the 95% confidence interval. Worth saying, though, is that I’ve been playing with this all week. An earlier equation I worked on was as follows:
Predicted Municipal Voter Turnout = 7792.719 + (Prelim Voter Turnout x 0.4436853) + (Number of Ballot Questions x 1832.269) + (Total Number of Mayoral Candidates in the Prelim Election x 938.3736) – (Number of Mayoral Candidates in the Prelim Election Who Were Women x 1350.748) + (Number of At-Large Candidates in the Prelim Election x 228.9357)
I really wanted to use more of the variables that I’d spent so much time encoding! That equation had an Adjusted R-value of 81% of the variance in the data, but more of the coefficients were not as good p-values, and the calculation came out to 23,016 total predicted voters in the general election. I’m sad to say, I think that a 23k turnout is highly optimistic. If we do manage to hit 23k voters in the general, though, I hope someone buys me a beer!
Do I Have Any Big Conclusions?
Please vote, Somerville! Voter registration info and deadlines are on the city’s elections page. Friday, October 24th is the deadline to register. There are early voting booths available October 28-30th. Election day is Tuesday, Nov 4th. I truly think that folks who are eligible to vote should do so; I think it makes our community stronger when more people participate in community decisions.

An update on Ballot Question 1: There’s now a website that has a side-by-side comparison of old charter vs proposed new charter. (Also, fun Golden Girls meme. LOL.)
LikeLike